

Introduction
webMethods ‘Optimize for process’ is component which is responsible for monitoring the customer requests, generating statistics, calculate the KPIs, and notifying you with any violation for the rules you define to monitor your business process.
In this article we will cover the following:
- The possible options to send data to ‘Optimize for business process’.
- How to send data from ‘WM Business Process’ to Optimize.
- How to send data from ‘WM flow service’ or any third part application.
- How to configure a new event in Optimize through ‘MyWebMethods’
- Configure KPIs, and Dimension.
Note: all the information in this article is based on webMethods version 8.2.
1. Possible options to send data to Optimize for Business Process.
There are two ways to send data to Optimize:
- Use the data in the ‘Business Process’ Model pipeline and the model will send it automatically with doing some configuration in the model using ‘SoftwareAg Designer’ and in the business process configuration through MWS.
- Use the Web service Data collector to send the information you need to the Optimize. In this case you will have to extract the WSDL from the WS Data collector, generate the client using softwareAG designer or any other third-party application, and finally call it with the target parameters.
Regardless the option you choose from the two previous options to send the data to Optimize the rest of the configuration in the Optimize will be the same.
2. Sending data to optimize using ‘webMethods Business Process’.
To send data to Optimize through ‘WM Business Process’, follow the following steps in SoftwareAG Designer:
1. Create your model and define the inputs and outputs for each step.
2. Click on the step which has the information ready to be sent, and open the properties-> logged fields.

3. In the logged fields tab, choose the document which contains the information you want to send.
4. Build the model and deploy it.
5. Go in the MWS –> Business –> Business Processes.
6. Make sure that the option ‘Analysis Enabled’ is checked, if not click on ‘EDIT’ and enable it.

7. Run one instance of your model, by publishing the subscription document to the model. The model will send the event automatically to Optimize.
8. Check the new events In MWS under ‘MWS –> Analytics –> KPIs –> Business data’. The event will be under unmapped event types with the name of the model and the document checked in the logged feilds.

9. Now you are ready to configure the data in Optimize. We will discuss this part in section 4, after discussing sending the data using the ‘web-service data collector’.
3. Sending Data to Optimize using the web service Data collector
The web service data collector is a web service existing with the data collector webmethods components. It enables you to use the optimize even if you don’t use business process model. So we use it to simulate the action taken by the model to send the logged feilds to Optimize.
Use the following address to extract the web service data collector WSDL:
http://datacollectorServer:12603/services/WSDimensionalDataCollector.wsdl
Note: The web service data collector signature has been changed after the Optimize_8.2.1_fix_9. So it is strongly recommended to install the following fixes before start using the optimize version 8.2.1.
- Optimize_8.2.1_fix_9 or Optimize_8.2.1_fix_10
- Process_Engine_8.2.1_fix_8 (as the logged fields will not send the data to optimize after installing the optimize_fix_9)
Here is a screen short from calling the web service data collector in the softwareAG Designer.

After calling the web service data collector with your data during the execution of the flow service, you will be able to see the new event (in the screen shot ‘TestEvent’) in the ‘MWS –> Analytics –> KPIs –> Business Data –> unmapped event type’
At this point all the configuration will be done with the optimize using the MWS.

3. Configuring the new Events in Optimize through MyWebmethods.
The following part is common for all the events sent to optimize, regardless of the way used to send the data to Optimize (logged fields or WS data collector). We will use the example created in section 1 (using the logged fields), the document used is ‘salesOrder’.
3.1 Configuring the Event received
- Go to myWebMethods.
- Go to MWS –> Analytics –> KPIs –> Business Process
- Click on the event ‘DemoProcess – salesOrder’ under ‘unmapped Event types’.
- We will name the new event ‘salesEvent’, and choose the ‘DemoProcess’ from the dropdown list.
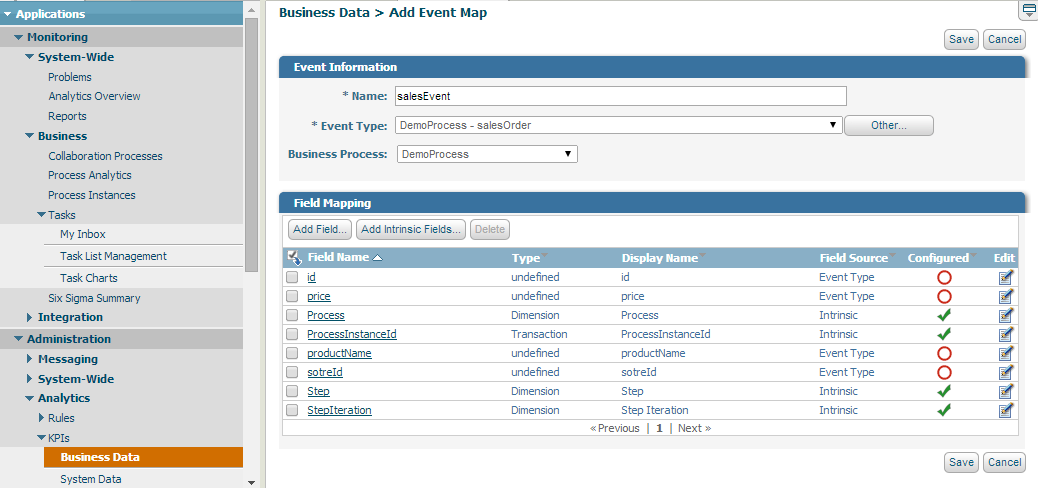
5. Click on the ‘Edit’ button for each variable to configure it.

6. Configuration variable in the event as follows:
| Feild | Display Name | Type | Calculation Type | UOM |
| Id | Id | Transaction | NA | NA |
| Price | Price | Fact | Sum | $ |
| productName | productName | Dimension | NA | NA |
| storeId | storeId | Dimension | NA | NA |
Note: UOM = Unit of measurement
Fact: use this type for the info involved in the calculation. In the example we want to calculate the revenue from the sold items (sum of prices), so the price must be a fact.
Dimension: use this type for the info which can be used to categorize the statistics or the requests. Example you need to know the revenue from sold item per store.
Transaction: It is a unique data for this transaction, this is the reason it is not used to generate any statistics. In our example we can consider the ‘Id’ is the serial number of the sold item.
7. Click the ‘Save’ button to save your configuration.
3.2 Configuring the KPI, and KPI Hierarchy
In this section we will see how to group and view the data generated from Optimize. So we will start with the KPI Hierarchy.
1. Go to MWS –> Administration –> Analytics –> KPIs –> KPI hierarchies.
2. Click the button ‘Add Hierarchy’.
3. Choose name for the hierarchy, in our example ‘MyProduct’.
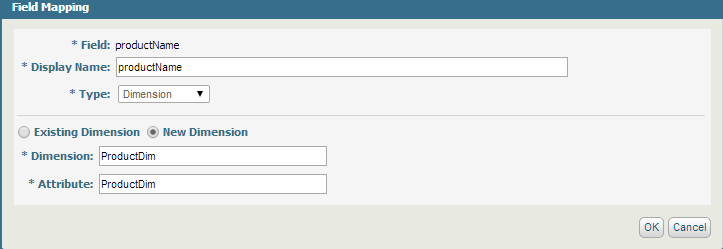
4. Choose the dimension, we will choose the productName dimension (ProductDim). We will explain in more details later.

Now we will define the KPI and assign it to the KPI hierarchy. Here are the steps:
- Go To MWS –> Administration –> Analytics –> KPIs –> Business Data
- Click the button ‘Add KPI’.
- We will name the KPI of this example ‘demoRevenue’.
- The collection interval we will choose 1 minute. During this interval the Optimize will be aggregating the data. For example if the collection interval is 1 day, then the Optimize will get the sum of the sales transaction by the end of day.
- In the KPI Information:
- Choose the event ‘salesEvent’.
- Fact will be the ‘price’.
- The hierarchy will be ‘MyProduct’
Note: the rest of the information will be created automatically from the configuration done before.
4. Viewing the statistics – Analytic Overview
Let us see the results of our work. Please run a couple of requests to make sure that the Optimize received some data. Here is a screenshot of the data sent to optimize.

To see the statistics please follow these steps:
- Go to MWS –> Monitoring –> Analytics Overview.
- Under the name of your process you will find the KPI folder with the data.
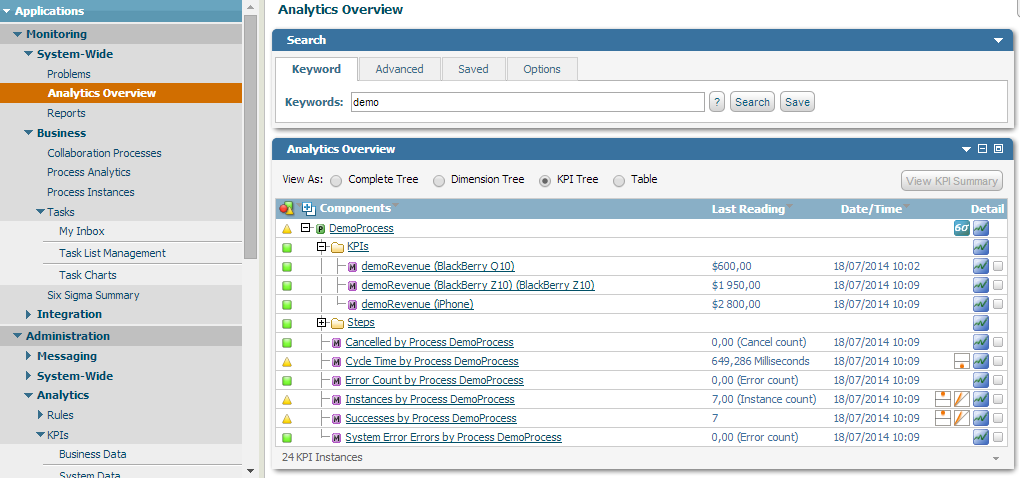
As you see in the screenshot the Optimize is using the dimension to categorize the revenue based on the ProductName (ex. demoRevenue (BlackBerry Q10)). The last reading means the last sum of prices of the sold products in the last collection interval which is 1 minute in our example.
3. We will go into the details of one of the dimensions.

And you can check the data instead of the graph by pressing the button ‘View Data’
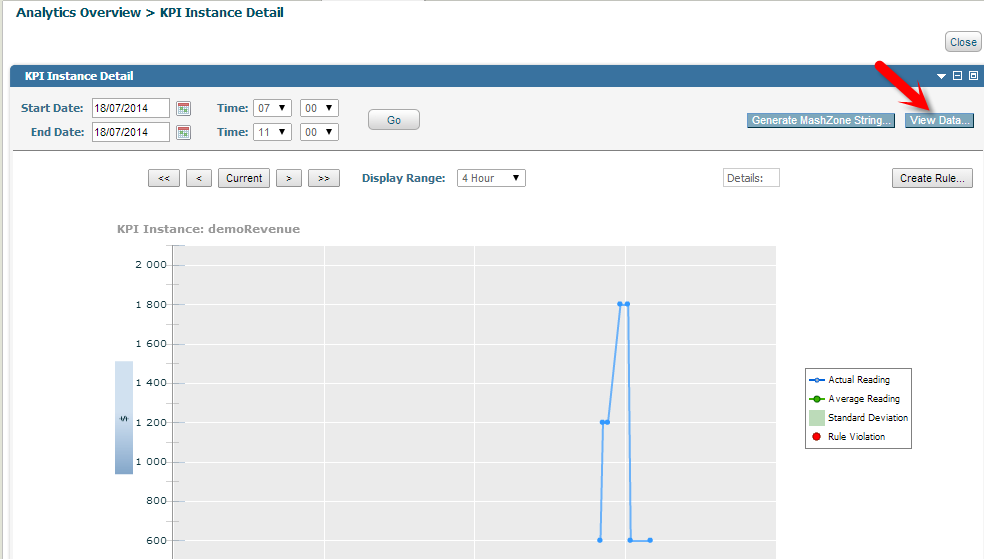
We can see in the below screenshot the aggregation done by Optimize in the collection interval. So if you need to get the revenue by day for this dimension, you can change the collection interval definition of the KPI.

You can also create rules by clicking the button ‘Create Rule’ to receive an alert when something goes wrong.

The data and aggregation done by Optimize is also available in the database, we will talk about how to extract the data from the database later …
We hope that you find this article useful, and we are looking forward reading your comments and questions.
© 2014 Hossam Elsharkawy. All rights reserved.
